Bus benchmarking study- Chandigarh and Bangalore
Introduction
The ‘Bus Benchmarking’ exercise is intended to help bus operators understand their business better by benchmarking themselves against other operators. Traditionally such comparisons have been carried out through various ‘Key Performance Indicators (KPIs)’ that define the performance i.e. outcome of bus operations. These include KPIs measuring physical, operational and financial performance of the operator, often defined according to the departmental sub-divisions used for auditing purposes. However, the definitions and data sources for measuring KPIs vary between operators, therefore making it difficult to compare them against each other.
In order to overcome the challenge of varying KPIs, the UITP Bus Committee developed a macro-economic management model that compares operators based on a common set of activities which are available across most bus operators. The targeted audience of this macro-economic exercise are the top management of the bus operator including the Chief Executive Officer (CEO) and the Board Members.
With support from Shakti Sustainable Energy Foundation (SSEF) UITP applied the ‘Bus Benchmarking’ model to two Indian Cities Chandigarh and Bangalore
Even though multiple bus operators are benchmarked across various activities, this is not a comparative exercise. The objective here is to tell leaders how the company they are responsible for is positioned compared to the others. The model will not necessarily give all the answers but it will help to raise the right questions. The benchmarking exercise does not focus on the technical aspects of a bus operation. It gives a holistic view on all the activities performed within a company. The purpose is to present a new way of allocating costs and presenting other cities for example.
Bus Benchmarking Methodology
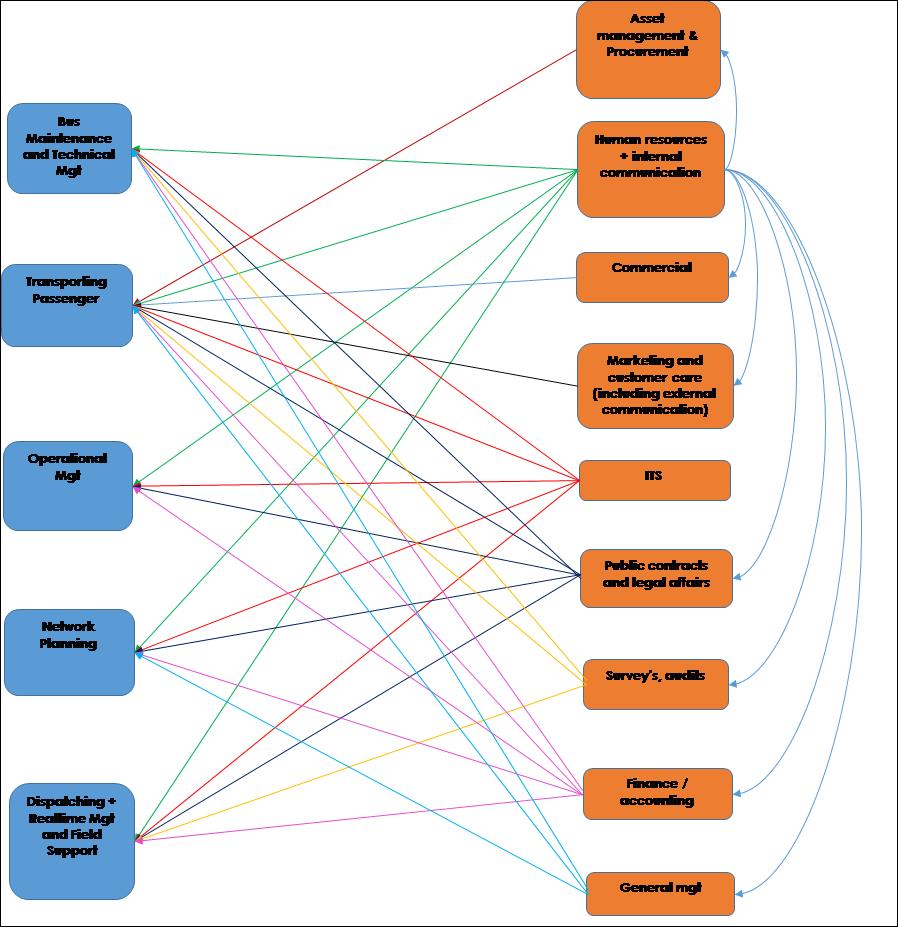
The Bus benchmarking exercise follows a 3 step methodology. Once the 3 first steps are completed, the final step is the Benchmarking between networks.
Step 1:Define total cost of the bus operation
Step 2:Allocate costs to direct and support activities
Step 3:Allocate costs of support activities to direct activities (using common keys – see below)
The segregation of direct and supporting activities helps bus companies in a detailed evaluation of their cost structures and helps them identify specific areas for course-correction. Additionally, the supporting activity costs have been allocated to the specific direct activity they support, to estimate the total resource consumption across all direct activities. These three steps are summarized in the following figure.
Direct and Support activities for benchmarking and their allocations
Data from Bangalore and Chandigarh
This section presents an overview of how BMTC and CTU compare to the rest of the participating companies on various parameters and to highlight the key differences. The remaining companies have been presented anonymously due to the Non-Disclosure Agreements UITP signed with them.
Key characteristics of Bangalore and Chandigarh bus companies
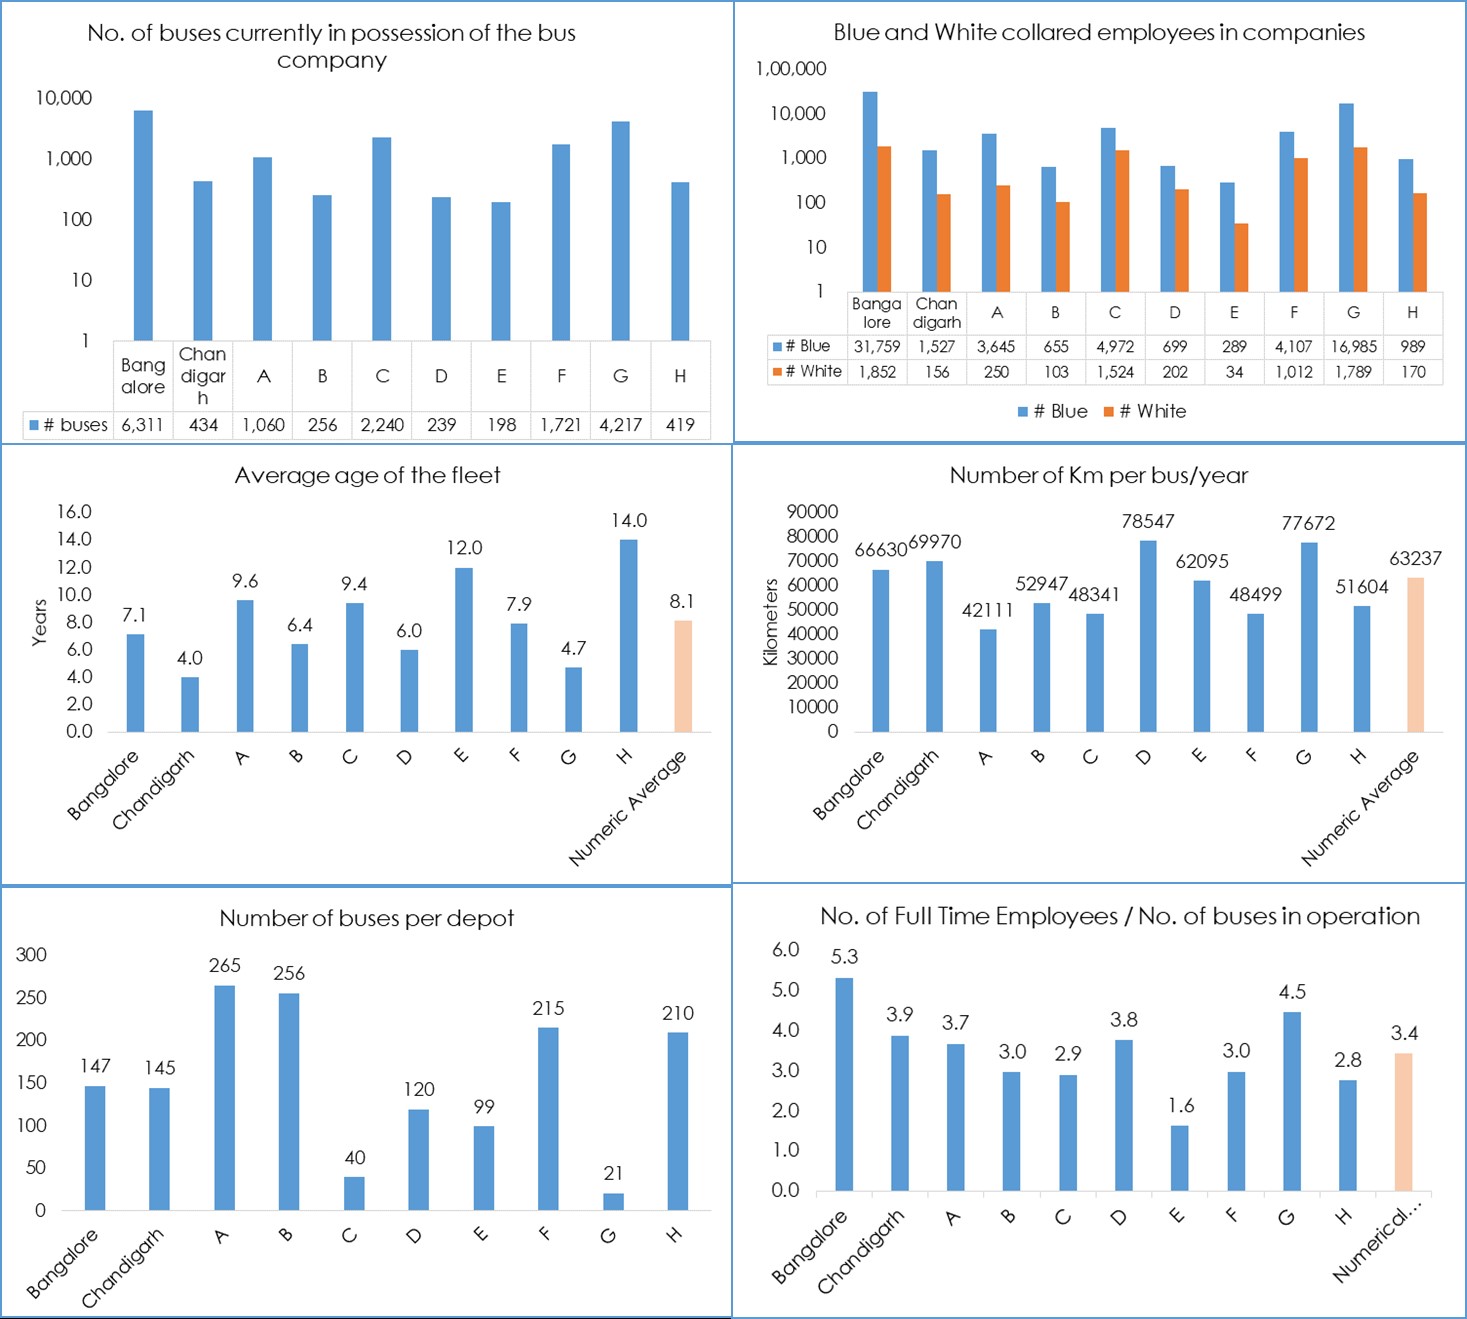
Benchmarking of Bangalore and Chandigarh
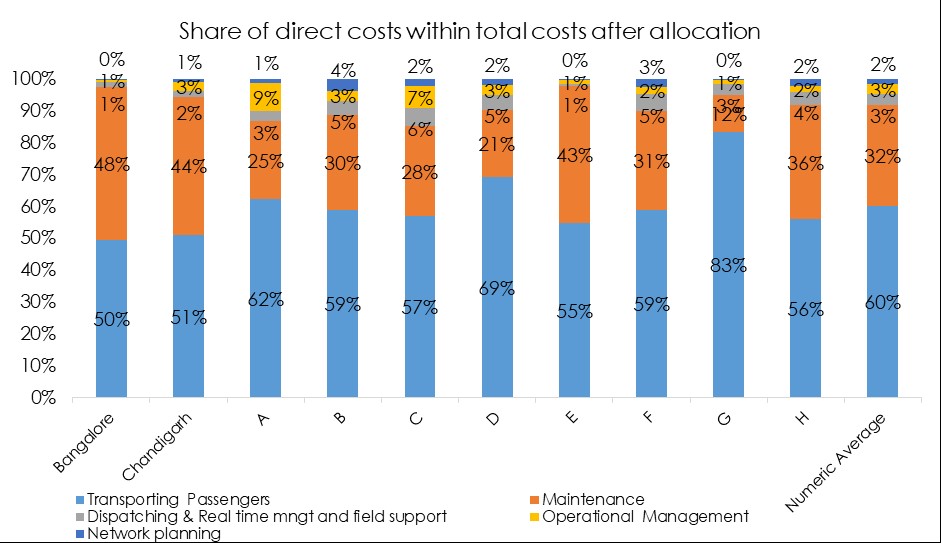
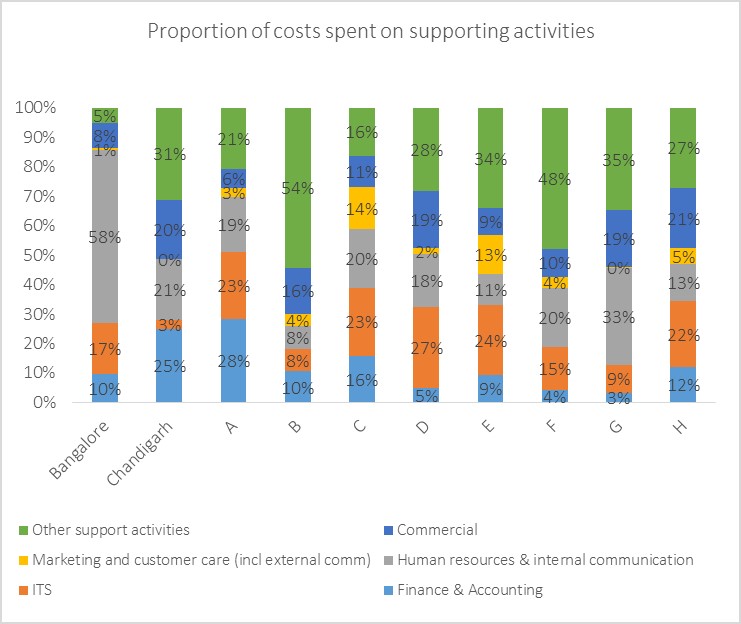
Bangalore and Chandigarh spend approximately 91 percent of their costs on direct activities, while the average for the remaining companies spend 81 percent. This leaves the Indian operators with inadequate funds for various support activities. Among the direct activities, majority of the costs are allocated to transporting passengers i.e. costs incurred on bus drivers and conductors. Within the limited costs allocated to supporting activities, majority of the costs are incurred on Human Resources (HR) activities, followed by Intelligent Transport Systems (ITS) and financial accounting. As a result key supporting activities like asset management, financial management and service audits have negligible investments.
Proportion of cost spent on various Direct Activities
Proportion of cost spent on various Supporting Activities
Finally, the supporting costs are allocated to the direct costs to which they are linked to derive the share of direct costs within total costs. This results in a new aggregate view of the results with a total for each of the 5 direct activities. The following chart presents these results. Bangalore and Chandigarh have the least proportion of costs allocated to transporting passengers, dispatching buses and their management. This is due to a significantly higher proportion of costs allocated to maintenance activities.
Findings from Bus Benchmarking exercise
The results of the ‘Bus Benchmarking’ exercise for Indian cities were different to most other International organisations. The key actionable recommendations from the exercise are listed below:
– The number of employees per bus is found to be highest in Indian cities, primarily due to the presence of a conductor in each bus i.e. two or more staff per bus per day, considering an average of two eight hour shift for the crew.Even the maintenance staff per bus is the highest in India, presumably due to higher wear and tear on Indian roads and lesser mechanization of depot and workshop activities
– The maintenance costs of Bangalore and Chandigarh are the highest among all citiesthat were compared through the exercise. These cities also have a very young fleet compared to the remaining companies. Both these statistics point to the need for Indian bus companies toprocure better quality buses and also improve their maintenance practices. Various alternatives like mechanization of depots, outsourcing maintenance activities etc. should be explored to bring down the maintenance costs, thereby allowing the bus companies invest more in transporting passengers.
– The proportion ofcosts of Indian bus operators on supporting activitieslike Intelligent Transport Systems (ITS) for improved dispatching and real time management, network planning, scheduling and operations optimisationis the least among all the companies compared in this exercise. Therefore, companies need to invest more in such activities to reduce their overall cost of operations and improve productivity of their resources.
An initative supported by: Shakti Sustainable Energy Foundation (SSEF)
Download the copy of the report:short-version| Full Version (On Request)
Related Resources
 news
news The Future of Buses in Europe: Results of Europe Bus Fleet Survey 2023
 news
news What is bus headway? (And how it impacts public transport quality)
 publication
 On the road to a concept for BRT
 publication
 Bus Tender Structure: 2023 Update
 publication
 Depot adaptations for clean bus technologies 2: Fuel cell hydrogen bus depots
 news
news UITP delegation proposes crucial accessibility amendments to UN bus construction regulation
 news
news ‘Security is never a cost, always an investment’: talking security and safety with the SAFE BUS project
 news
news UITP India and ICCT collaborate to unveil roadmap for zero emission bus transition in Bengaluru