5 key public transport trends revealed in our Global Economic Outlook 2024
Taking the pulse of the public transport sector
Time for a temperature check. Every other year, UITP conducts a survey to gauge the financial health and future of public transport organisations across the world. The results help paint a picture of the prevailing trends in public transport, which can ultimately help us better understand where we are as a sector and where we are headed.
Let’s explore just 5 public transport trends that the survey makes clear.
Want the full insights? Download the Statistics Brief!
The survey attracted contributions from across the public transport world:
- 111
responses
- 66
operators
- 45
authorities
- 47
countries worldwide
#1 Mobility demand on the rise
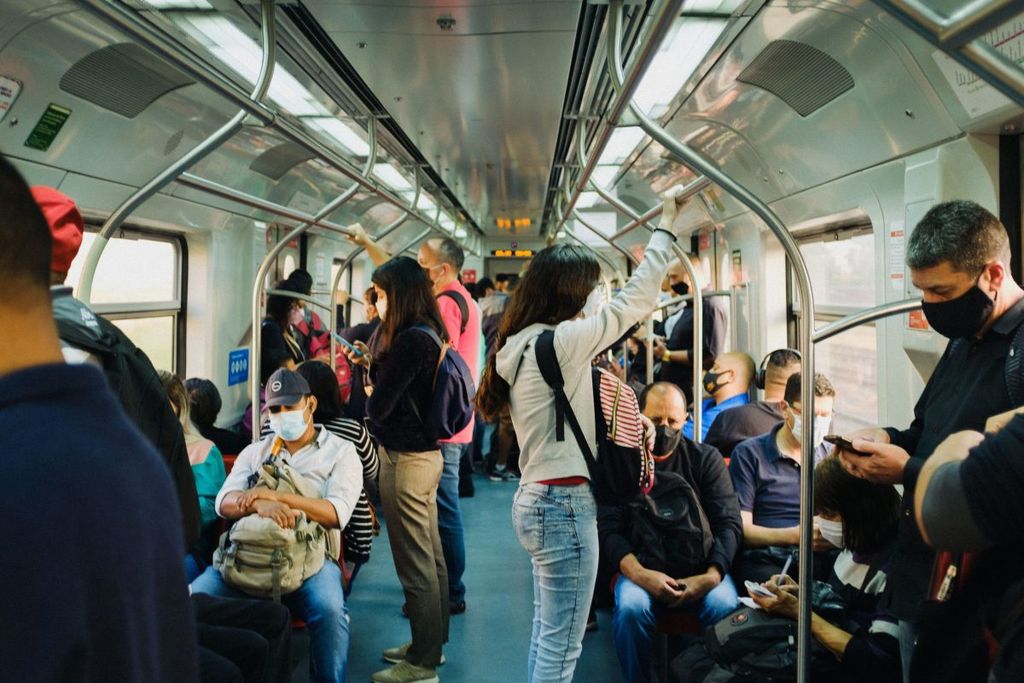
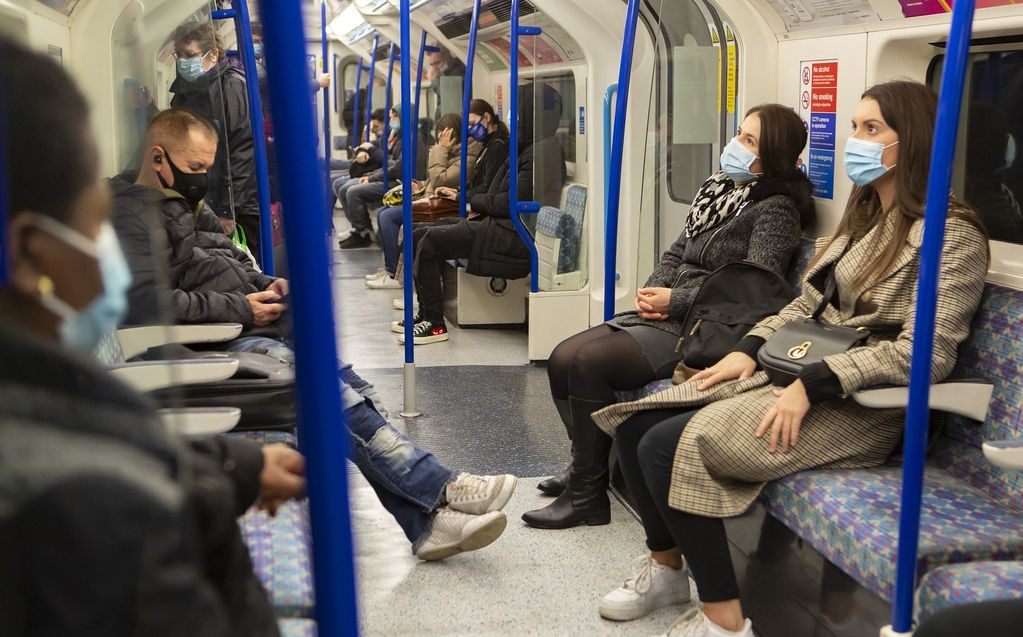
A big story of the past few years is rising demand for public transport, and this survey confirms that. While more than half of operators surveyed remain below 2019 ridership levels, 83% expect growth in 2024 compared to 2023. At the same time, North and Latin American operators report lower expectations than their European and Asia-Pacific counterparts.
Still, many factors influence ridership and have left levels generally lower around the globe. For example, lifestyle changes from homeworking and the resulting reduction in commuting, as well as a rise in the cost of living. Though the biggest impact to ridership comes from the provision of services, that is to say reliability, frequency, and quality. These are things that public transport must focus on and improve to encourage a further modal shift away from cars and onto buses, trains, trams, shared bikes, and more.
#2 Fare policy and social fares as a clear objective
With the cost of living in our minds, equitable and inclusive fare policy is a clear objective for our sector. That means fare reductions for certain passenger segments, such as individuals with disabilities, children, students, pensioners, and more. Most respondents shared that household expenditure on transport sits between 9-14% of total income. For 2024, that means a stable or increasing budget for social fares.
On the other side of this, authorities see fare reductions as a low priority. This indicates a more targeted and differentiated approach to fare levels. Instead, fare policy will focus on developing contactless payment solutions and implementing an integrated ticketing system. Put simply, making it easier to pay for those who are able – and making it less burdensome for those who have more financial difficulty.
#3 Fare revenues are increasing
For public transport operators, the average coverage rate, (that is the proportion of costs covered by fare revenues), is between 31-50%. Though this is hard to gauge – many organisations are still assessing their levels, and in some places it is too difficult to find a clear answer given that particular local policies can complicate the picture.
But of the 76 organisations who shared their fare revenue data, two-thirds say that fare revenues are increasing in comparison with 2023. African respondents were the most optimistic, while Latin America had tempered expectations. Of non-fare revenues, advertising and retail are areas of significant growth, with new funding sources like taxes, levies, and other commercial income remaining stable.
#4 Higher capital costs are expected (but that won’t stop investment)
Costs are up. It’s a familiar story. Energy, personnel, maintenance, and investments are expected to contribute the lion’s share of an increase in capital costs of 2-10%. All this makes stabilising costs a critical priority for the public transport sector.
But investment is critical for the future of our sector. The sustainable transition demands huge investment, which is much more expensive to undertake than even just a year ago. However, it is clear that the sector is not put off by these costs. Respondents indicate that investments will continue as planned and new projects will continue to be developed. Many are even accelerating the level of investment.
Most infrastructure investments for both operators and authorities are short-term – 68% of respondents indicate that they have a short-term capital investment programme, but just 13% have one with a 30-40 year time frame. By far, the most common financing instrument is a subsidy or grant from government. To be sure, stable and sufficient government funding remains the bedrock of the public transport sector.
#5 Budgets are growing
Again, spending is up. That’s pushing the overall annual budget of operators and authorities up too. A large majority of authorities report an extraordinary increase of between 2-10% in budget sizes, whereas a plurality of operators report increases in the range of 1-5% of the annual budget. While there is large variation on where funding comes from and how much is provided, municipalities stand out as contributors compared to regional or national governments.
The future of public transport
Recap of Global Economic Outlook 2024
With all this in mind, let’s recap what we can observe from the Global Economic Outlook 2024:
- Ridership is generally up,
- Fare revenues are then increasing,
- While fare policy is becoming more inclusive and integrated.
- At the same time most costs have risen significantly,
- Though this hasn’t slowed crucial investment,
- All ultimately leading to bigger budgets.
Sustainable mobility is more the future of public transport than ever, whatever the roadblocks are that we as a sector face. The commitment is there and the path is laid out for us. As the years continue, and we look to the Global Economic Outlook 2026, time will tell what trends stick around and which don’t. But for now, from this survey of over a hundred organisations, we can say that the outlook appears optimistic.


